Table of Contents
The purpose of this chapter is to show how one can have one set of data displayed with two different scales that are still synchronized meaning that the tick marks are at identical positions.
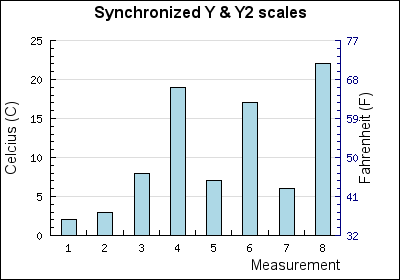
One classic example of when this can be useful is to show temperature in both Celsius and Fahrenheit. Figure 28.1 below illustrates what we would like to accomplish.
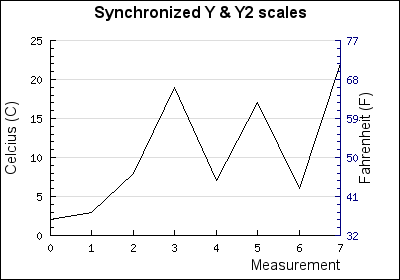
Normally the auto scaling puts tick marks at "nice" positions that for example are multiples of 5,2,10 and so on. This would mean that it seems like the graph in Figure 28.1 with tick positions at 59 F and 68 F can not be auto scaled.
The simplest method of creating two scales as in the example above is to add a secondary Y-axis, add the same plot to that axis. This would then mean that the two axes would be identical. The magic now happens in the last step when we add a format callback method to the second Y-axis. This format callback will be applied to each label. All we have to do now is create a callback function that does the proper scale conversion.
This way also means that we have too chose one of the scales as the "master" which will be auto scaled with tick positions at "nice" intervals.
Caution
For the second scale one can add the same plot or one could create a new plot from the same data set. If the data set to be plotted is very large it can be advantageous to create a new plot and set the line weight to 0 (zero). This way the line will not actually be plotted and that plot time is eliminated.
The script to create the graph in Figure 28.1 is given below.
Example 28.1. (y2synch.php)
1 2 3 4 5 6 7 8 9 10 11 12 13 14 15 16 17 18 19 20 21 22 23 24 25 26 27 28 29 30 31 32 33 34 35 36 37 38 39 40 41 42 43 44 45 46 47 48 49 50 51 52 53 54 55 56 57 58 59 60 | // content="text/plain; charset=utf-8" require_once ("jpgraph/jpgraph.php"); require_once ("jpgraph/jpgraph_line.php"); require_once ("jpgraph/jpgraph_bar.php"); function toFahrenheit($aVal) { return round(($aVal*9/5)+32,2); } function toCelcius($aVal) { return round(($aVal-32)*5/9,2); } $datay =array(2,3,8,19,7,17,6,22); // Create the graph. $graph = new Graph(400,280); // Slightly bigger margins than default to make room for titles $graph->SetMargin(50,60,40,45); $graph->SetMarginColor('white'); // Setup the scales for X,Y and Y2 axis $graph->SetScale("intlin"); // X and Y axis $graph->SetY2Scale("lin"); // Y2 axis // Overall graph title $graph->title->Set('Synchronized Y & Y2 scales'); $graph->title->SetFont(FF_ARIAL,FS_BOLD,12); // Title for X-axis $graph->xaxis->title->Set('Measurement'); $graph->xaxis->title->SetMargin(5); $graph->xaxis->title->SetFont(FF_ARIAL,FS_NORMAL,11); // Create Y data set $lplot = new LinePlot($datay); $graph->yaxis->title->Set('Celcius (C)'); $graph->yaxis->title->SetMargin(5); $graph->yaxis->title->SetFont(FF_ARIAL,FS_NORMAL,11); // ... and add the plot to the Y-axis $graph->Add($lplot); // Create Y2 scale data set $l2plot = new LinePlot($datay); $l2plot->SetWeight(0); $graph->y2axis->title->Set('Fahrenheit (F)'); $graph->y2axis->title->SetMargin(5); // Some extra margin to clear labels $graph->y2axis->title->SetFont(FF_ARIAL,FS_NORMAL,11); $graph->y2axis->SetLabelFormatCallback('toFahrenheit'); $graph->y2axis->SetColor('navy'); // ... and add the plot to the Y2-axis $graph->AddY2($l2plot); $graph->Stroke(); |
The same principle will also work with othrr plot variants, for example bar plots.
By making the first plot an instance of class BarPlot the graph in
Figure 28.2 can be created.