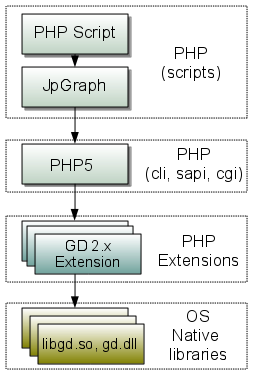
The purpose of the library is to make it possible to (very) easily create dynamic images (a.k.a. graphs) using PHP scripting. The library hides as much as possible all the details necessary to create dynamic images. Strictly speaking all the basic low level functionality to draw images are already available in PHP since PHP comes with the core GD library which is the very lowest layer to create images. The GD library has graphic primitives to create lines, circles, points etc. but it has no built-in intelligence to handle scales, labelling , colors etc. This logically makes JpGraph library a higher type library more easily accessible than the raw GD library.
There are several possible usage scenario for the library and it's different parts.
The most common usage is most likely to visualize numeric data by creating basic
charts (for example line, bar or pie charts) that is included dynamically in a
WEB-page via a straight forward <img> tag. The details on how to
create dynamic graphs will be fully covered in later sections of this manual The
library itself is agnostic to where the data comes from so it could for example be
retrieved from a database, from a plain text file or perhaps from some WEB-service.
In addition to this scenario the library could be used as a tool to create dynamic
charts that are stored as image files in a directory. This makes it possible to use
the library in an off-line batch mode from the command line (most likely using the
cli =command line version of PHP). For an example of using JpGraph in batch mode see Chapter 30.
In addition to these basic usage scenarios both the free and the slightly more advanced pro-version of the library includes a multitude of additional functionality which includes for example more advanced graph types (like spider graphs, polar plots, contour plots etc.) and some non graph capabilities like the possibility to create barcodes (only available in the pro-version) or to create Gantt-charts. The usage of all of these types of graphs are explained in this manual.
Caution
In order to use JpGraph the PHP installation must have support for the GD libraries enabled. See Chapter 2 and 3 for details on checking the installation.
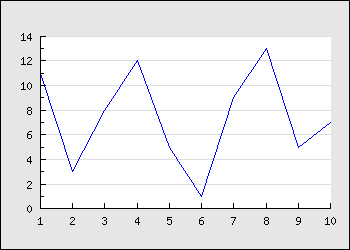
In order to get a quick feel for how the library can be used we have included in Example 1.1 a very basic type of line graph. Don't worry right now about the details, the message here is that it only takes six lines of real script code to create a basic graph. Have a look at the example and see just how much of the script makes sense without us even having discussed any API yet.
Example 1.1. This is the very first example (example0.php)
1 2 3 4 5 6 7 8 9 10 11 12 13 14 15 16 17 18 19 20 21 | // content="text/plain; charset=utf-8" require_once ("jpgraph/jpgraph.php"); require_once ("jpgraph/jpgraph_line.php"); // Some data $ydata = array(11,3,8,12,5,1,9,13,5,7); // Create the graph. These two calls are always required $graph = new Graph(350,250); $graph->SetScale('textlin'); // Create the linear plot $lineplot=new LinePlot($ydata); $lineplot->SetColor('blue'); // Add the plot to the graph $graph->Add($lineplot); // Display the graph $graph->Stroke(); |