Normally we don't want to have to calculate the absolute x and y coordinates when positioning multiple Matrix plots in graph. A much better concept would be to just tell the library to position three matrix plots horizontally or vertically without having to figure out the exact coordinates our self but just evenly distribute them in the specified direction.
This is where layout classes come in handy.
There are two types of layouts; horizontal and vertical. To specify that two matrix plots should be positioned side by side (horizontal) a new horizontal layout object is created and then the two matrix plots are added as object within the horizontal layout class. Later on when the objects are about to be stroked on the graph the horizontal layout class will take all its objects and spread them out evenly along a horizontal line depending on the individual size of each matrix plot (including the specified margin). The same principle applies to the vertical layout class with the obvious change in direction.
The layout object are added to the graph in exactly the same way as ordinary matrix
plots, by calling the MatrixGraph::Add() method.
The following line would create a horizontal line of three matrix plots
1 2 3 4 5 6 7 8 9 10 11 12 13 14 | $graph = new MatrixGraph($width,$height); // additional graph formatting $mp1 = new MatrixPlot($mat1); $mp2 = new MatrixPlot($mat1); $mp3 = new MatrixPlot($mat1); $hor = new LayoutHor( array( $mp1, $mp2, $mp3) ); $graph->Add($hor); $graph->Stroke(); |
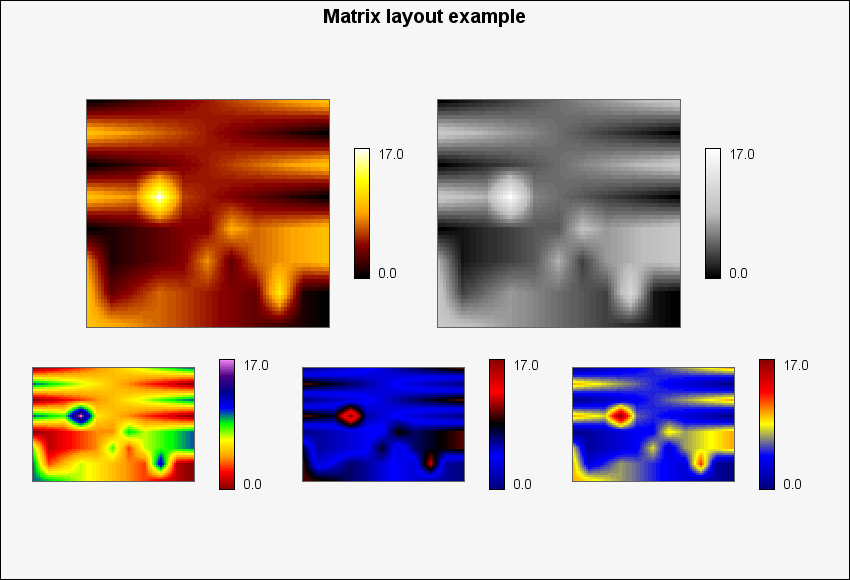
A complete example of this can be seen in Figure 22.12
Example 22.4. Using layout classes with Matrix plots (matrix_layout_ex1.php)
1 2 3 4 5 6 7 8 9 10 11 12 13 14 15 16 17 18 19 20 21 22 23 24 25 26 27 28 29 30 31 32 33 34 35 36 37 38 39 40 41 42 43 44 | require_once('../jpgraph.php'); require_once('../jpgraph_matrix.php'); $data = array( array(0,1,2,3,4,5,6,7,8,9,10), array(10,9,8,7,6,5,4,3,2,1,0), array(0,1,2,3,4,5,6,7,8,9,10), array(10,9,8,17,6,5,4,3,2,1,0), array(0,1,2,3,4,4,9,7,8,9,10), array(8,1,2,3,4,8,3,7,8,9,10), array(10,3,5,7,6,5,4,3,12,1,0), array(10,9,8,7,6,5,4,3,2,1,0), ); doMeshInterpolate($data,4); $graph = new MatrixGraph(850,580); $graph->title->Set('Matrix layout example'); $graph->title->SetFont(FF_ARIAL,FS_BOLD,14); $mp = array(); $n = 5; for($i=0; $i < $n; ++$i){ $mp[$i] = new MatrixPlot($data); $mp[$i]->colormap->SetMap($i); if( $i < 2 ) $mp[$i]->SetSize(0.35); else $mp[$i]->SetSize(0.21); // We need to make the legend a bit smaller since by // defalt has a ~45% height $mp[$i]->legend->SetModuleSize(15,2); } $hor1 = new LayoutHor(array($mp[0],$mp[1])); $hor2 = new LayoutHor(array($mp[2],$mp[3],$mp[4])); $vert = new LayoutVert(array($hor1,$hor2)); $vert->SetCenterPos(0.45,0.5); $graph->Add($vert); $graph->Stroke(); |
When using layout classes there is one parameter of the matrix plot that can be adjusted and that is the margin around each matrix plot. This margin is controlled by a call to
MatrixPlot::SetMargin($aMargin)
By default the margin is 20 pixels on each side. This margin also takes the legend into consideration so the margin is counted from the edge of the legend.