Table of Contents
- 19.1. Introduction
- 19.2. Constructing tables
- 19.2.1. Basic tables
- 19.2.2. Merging cells
- 19.2.3. Font adjustment
- 19.2.4. Color adjustment
- 19.2.5. Adjusting table and cell sizes
- 19.2.6. Fine tuning cell alignment and cell padding
- 19.2.7. Adjusting border and grid lines
- 19.2.8. Specific number formatting
- 19.2.9. Using images and country flags in the table
- 19.3. CSIM Table support
- 19.4. Table API Overview
- 19.5. Examples
- 19.6. Case study: Adding a table to a bar graph
Note
This module is only available in the pro-version of the library.
When visualizing data it is often useful to have both a quick graphical view which can show high level trends and a detailed table view with the exact figures. The table module supports the creation of an almost endless varieties of tables.
The table library module will allow any kind of rectangular table with an arbitrary number of rows and columns. user selectable size, cells may be merged with other cells, have individual background colors, different fonts and various types of borders.
Since graphic tables can be created as objects this also means that they can be added to ordinary graph types in much the same way as for example icons and text objects.
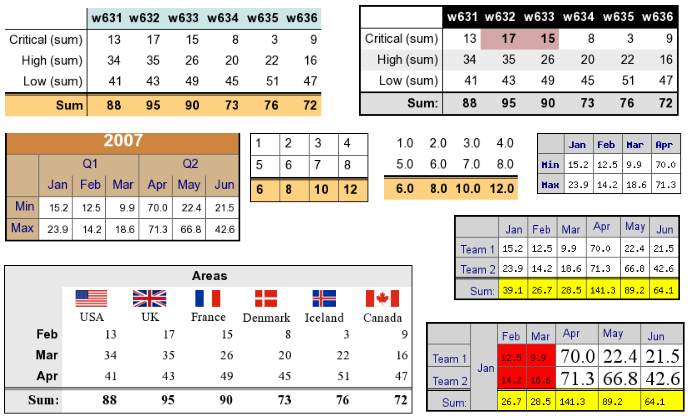
A good way to get an idea of the capabilities of the library is to review Figure 19.1 where a number of different tables that all have ben created with the library are shown. In the remainder of this chapter the APIs available will be explained by means of a number of worked through examples.
Since table has full support for Client Side Image Maps (CSIM) they can also be used a launch pad to take the user to further detailed information.
In addition to adding data tables to graphs it is also possible to create graphic tables on the fly all by its own. This has the advantage compared with HTML tables to allow users to make copies of the table while maintaining the exact formatting of the table.
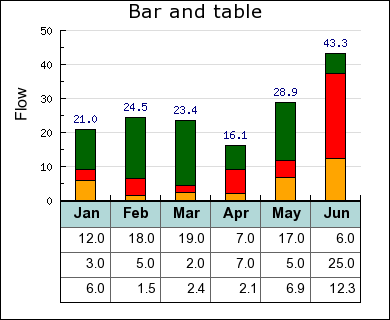
In addition to the standalone tables shown above another common usage is to combine a graph and a table. An example of how this can be done is shown in Figure 19.2 below. The exact steps how to create this graph is described in Section 19.6.