The easiest way to get a date time scale for the X-axis is to use the pre-defined
"dat" scale. To be able to use that it is first necessary to
include the module "jpgraph_date.php" and then specify the
scale, for example as "datlin" in the call to
Graph::SetScale() as the following code snippet shows.
1 2 3 4 5 6 7 8 9 | require_once( "jpgraph/jpgraph.php" ); require_once( "jpgraph/jpgraph_line.php" ); require_once( "jpgraph/jpgraph_date.php" ); ... $graph = new Graph ( ... ); $graph->SetScale( 'datlin' ); ... |
It is possible to use a selectable degree of automation when dealing with date scales. The easiest way is to let the library deal with all the details and make it own decision on how to format the scale. Unfortunately this might not always be exactly what was intended and hence it is also possible to give the library hints on how the formatting should be done or specify to a great details the exact formatting needed.
Bot the y- and the x-axis can have a date scale but the most common case is to only use date scale on the x-axis.
No matter how the formatting is done the input data is assumed to be a
timestamp value, i.e. the number of seconds since epoch (as defined on the local
system executing the graph). In PHP the current timestamp value is returned by
the function time().
This means that it is always mandatory to specify two input vectors for a plot.One vector for the Y-data and one vector for the x-data. The following line of code prepares a line plot for the use with a date scale
1 | $lineplot = new LinePlot( $ydata , $xdata ); |
Caution
Note the order of the data vectors. The Y-data always comes first.
A first example is shown in Figure 14.65 where we have created a number of random points with a sample interval of 240s (chosen completely arbitrary)
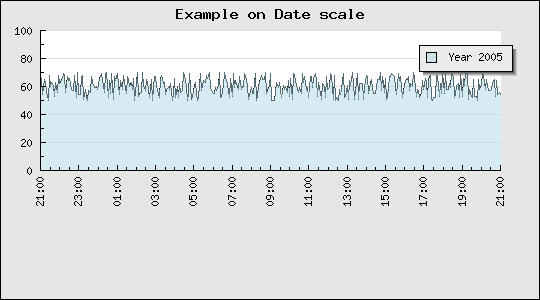
Please review the script that creates this graph before continuing since we will base all further examples on this.
As can be seen from the example in Figure 14.65 the scale starts slightly before the first data point.
Why?
This is of course by purpose in order to make the first time label start on an "even" value, in this case on an hour. Depending on the entire interval of the graph the start value will dynamically adjust to match the chosen date/time interval, this could for example be on an even minute, even 30min, even hour, even day, even week and so on. It all depends on the scale.
The alignment of the start (and end) date can also be adjusted manually by using the two methods
DateScale::SetTimeAlign($aStartAlign,$aEndAlign)The following symbolic constants can be used to define the time alignment
Alignment on seconds
MINADJ_1, Align on a single second (This is the lowest resolution)
MINADJ_5, Align on the nearest 5 seconds
MINADJ_10, Align on the nearest 10 seconds
MINADJ_15, Align on the nearest 15 seconds
MINADJ_30, Align on the nearest 30 seconds
Alignment on minutes
MINADJ_1, Align to the nearest minute
MINADJ_5, Align on the nearest 5 minutes
MINADJ_10, Align on the nearest 10 minutes
MINADJ_15, Align on the nearest 15 minutes
MINADJ_30, Align on the nearest 30 minutes
Alignment on hours
HOURADJ_1, Align to the nearest hour
HOURADJ_2, Align to the nearest two hour
HOURADJ_3, Align to the nearest three hour
HOURADJ_4, Align to the nearest four hour
HOURADJ_6, Align to the nearest six hour
HOURADJ_12, Align to the nearest tolw hour
DateScale::SetDateAlign($aStartAlign,$aEndAlign)The following symbolic constants can be used to define the date alignment
Day alignment
DAYADJ_1, Align on the start of a day
DAYADJ_7, Align on the start of a week
DAYADJ_WEEK, Synonym to DAYADJ_7
Monthly alignment
MONTHADJ_1, Align on a month start
MONTHADJ_6, Align on the start of halfyear
Yearly alignment
YEARADJ_1, Align on a year
YEARADJ_2, Align on a bi-yearly basis
YEARADJ_5, Align on a 5 year basis
Some examples will clarify the use of these methods.
Example 14.7. We want the time adjustment to start on an even quarter of an hour, i.e. an even 15 minute period.
1 | $graph->xaxis->scale->SetTimeAlign( MINADJ_15 ); |
Example 14.8. We want the time to start on an even 2 hour
1 | $graph->xaxis->scale->SetTimeAlign( HOURADJ_2 ); |
Since a date scale is special case of an integer scale (the underlying format of dates a timestamps which are large integers) it is perfectly possible to manually adjust the interval between each label. The interval is specified in seconds with a call to the usual
LinearTicks::Set($aMajorTicks,$aMinorTick)
as the following code snippet shows
1 2 3 4 5 6 7 8 9 10 11 12 | $graph->SetScale('datint'); // Adjust the start time for an "even" 5 minute, i.e. 5,10,15,20,25, ... $graph->xaxis->scale->SetTimeAlign(MINADJ_5); // Force labels to only be displayed every 5 minutes $graph->xaxis->scale->ticks->Set(5*60); // Use hour:minute format for the labels $graph->xaxis->scale->SetDateFormat('H:i'); |
In the above example the scale will start on an "even" 5 minute boundary and
then have labels every 5 minutes exactly. Of course strictly speaking the
adjustment with MINADJ_5 is not necessary but will avoid that the
scale starts on whatever happens to be the initial value of the data (which will
control how the first label is placed).
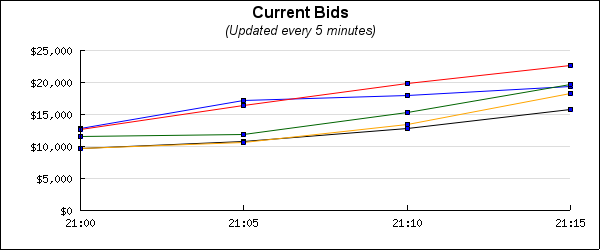
The graph in Figure 14.66 shows an example
where an online auction is displaying how the bids are increasing from each
participant every 5 minutes. The example also shows how to adjust the label
format on the y-axis to show currency values with 1000' separator by using a
label callback (using the PHP function number_format() ).
The default label format always tries to use the shortest possible unique string. To manually set a label format the method
DateScale::SetDateFormat($aFormatString)The format string uses the same format convention as the PHP function
date()
is used. For example
1 | $graph->xaxis->scale->SetDateFormat( 'H:i' ); |
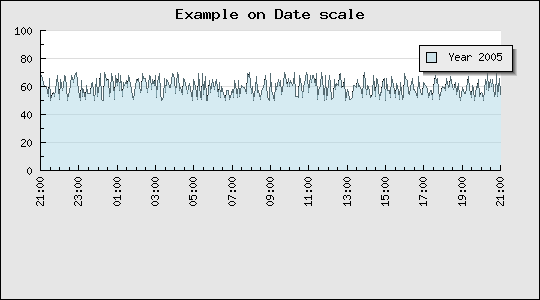
will display the hour (24h) and minutes in the label separated by a colon (':'). Using this format string together with the modified start/end alignment
1 | $graph->xaxis->scale->SetTimeAlign(MINADJ_10); |
with our previous date example will give the result shown in Figure 14.67
As with the linear scale it is possible to indicate what density of scale
ticks is needed. This is (as usual) specified with a call to
Graph::SetTickDensity($aMajDensity, $aMinDensity) for example
as
1 | $graph->SetTickDensity( TICKD_DENSE ); |
In the following we will assume that all data points are specified by a tuple
(time-value, date-value) where the
date/time is specified as a timestamp in seconds in the same format as is
returned by the PHP function time().
Caution
Be careful if data is gathered from a different time zone and whether it is given in UTC ot in the local time/date.
A label formatting callback routine will get called each time a label is to be drawn on the scale. The one parameter given to the callback function is the current time value. The returned string is then used as a label.
What we do is that we specify that the x-scale should be an ordinary integer
"int" scale (remember that the data values are timestamps which
are integers). We then install our custom label formatting callback (with a call
to Graph::SetLabelFormatCallback()) which given a timestamp returns
a suitable label as a string.
In our example we will use the PHP function date() to convert
between the time stamp value and a suitable textual representation of the
time/date value.
The callback we use is
1 2 3 4 | // The callback that converts timestamp to minutes and seconds
function TimeCallback ( $aVal ) {
return Date ( 'H:i:s' , $aVal );
} |
Using some random data we can now generate the graph shown in Figure 14.68
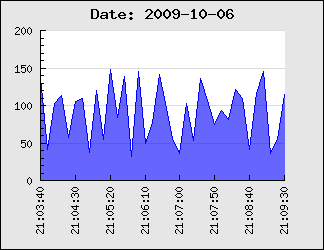
In the above example we have specified the x-scale manually to make sure that the min/max values on the X-axis exactly matches the min/max x-data values to not leave gaps (as discussed above) between the data and the start/end of the scale.
The defined callback function will be called for each of the displayed labels. Since we are using an integer scale the labels will be set according to an suitable scale when the time stamp values are interpretated as integers.
Using integer scales this will not work very well since the library determines label positions to be at even positions (e.g. every 2,5,10, 20,50,100 etc) to suit the auto-scaling since the library will assume that the data is integers and not time stamp values.
The best way to solve this is to use an integer x-scale together with a callback function with a manually specified scale.
In order to setup the scale a bit of manually work is needed. Depending on the data to be displayed one should ensure that the scale starts and ends at suitable times and that the tick interval chosen fits with an even multiple of minutes, hours, days or what is best suited for the time range that is to be displayed.
The following code example illustrates this. It creates some "fake" data that is assumed to be sampled time based data and sets up some suitable scales and tick interval. This script may be used as a basis for more advanced handling of the time data.
Example 14.9. Manually creating a date/time scale (timestampex01.php)
1 2 3 4 5 6 7 8 9 10 11 12 13 14 15 16 17 18 19 20 21 22 23 24 25 26 27 28 29 30 31 32 33 34 35 36 37 38 39 40 41 42 43 44 45 46 47 48 49 50 51 52 53 54 55 56 57 58 59 | // content="text/plain; charset=utf-8" // Example on how to treat and format timestamp as human readable labels require_once("jpgraph/jpgraph.php"); require_once("jpgraph/jpgraph_line.php"); // Number of "fake" data points DEFINE('NDATAPOINTS',500); // Assume data points are sample every 10th second DEFINE('SAMPLERATE',10); // Callback formatting function for the X-scale to convert timestamps // to hour and minutes. function TimeCallback($aVal) { return Date('H:i', $aVal); } // Get start time $start = time(); // Set the start time to be on the closest minute just before the "start" timestamp $adjstart = floor($start / 60); // Create a data set in range (20,100) and X-positions // We also apply a simple low pass filter on the data to make it less // random and a little smoother $data = array(); $xdata = array(); $data[0] = rand(20,100); $xdata[0] = $adjstart; for( $i=1; $i < NDATAPOINTS; ++$i ) { $data[$i] = rand(20,100)*0.2 + $data[$i-1]*0.8; $xdata[$i] = $adjstart + $i * SAMPLERATE; } // Assume that the data points represents data that is sampled every 10s // when determing the end value on the scale. We also add some extra // length to end on an even label tick. $adjend = $adjstart + (NDATAPOINTS+10)*10; $graph = new Graph(500,250); $graph->SetMargin(40,20,30,50); // Now specify the X-scale explicit but let the Y-scale be auto-scaled $graph->SetScale("intlin",0,0,$adjstart,$adjend); $graph->title->Set("Example on TimeStamp Callback"); // Setup the callback and adjust the angle of the labels $graph->xaxis->SetLabelFormatCallback('TimeCallback'); $graph->xaxis->SetLabelAngle(90); // Set the labels every 5min (i.e. 300seconds) and minor ticks every minute $graph->xaxis->scale->ticks->Set(300,60); $line = new LinePlot($data,$xdata); $line->SetColor('lightblue'); $graph->Add($line); $graph->Stroke(); |
In this section we will show a very common use case where the x-axis have the unit of timestamps and where the start of each month is labeled. This is difficult (impossible) to do with the automatic tick marks since this requires the distance between consecutive tick marks to be different.
Warning
To use manual tick marks the basic scale should be an integer scale
since the underlying data are integer time stamps, for example
SetScale('intlin').
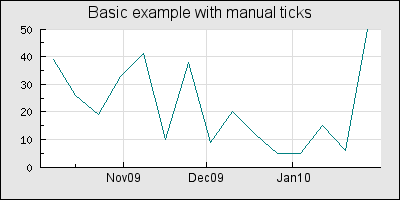
Figure 14.69 shows a basic example of what we want to achieve
To use the manual tick marks two steps are required
Determine where the tick marks should be. Both major (which can have a label and grid marks) and minor ticks can be specified. Optionally if complex labels, which cannot be calculated by a format string (either as date or
printf()format) needs to be created.Call the appropriate method to set the tick marks and optional labels.
We remind the reader that the following methods (in class Axis) are available to set the tick marks
Axis::SetTickPositions($aMajTickPos,$aMinTickPos=NULL,$aLabels=NULL)Axis::SetMajTickPositions($aMajTickPos,$aLabels=NULL)
The second method above is strictly speaking not necessary, it is just a convenience function for those cases where only major ticks and labels should be set.
The following related method will also be used in this example
Axis::SetLabelFormatString($aFormat,$aIsDateFormat=FALSE)
This method has been available for a long time in the library but it has
recently gained the second argument. With this argument it is possible to tell
if the formatting string should be interpretated as format according to the
standard printf() format or if it should be interpretated as a
format string to be used with the date() function.
Finally we will use a utility function that is available in
"jpgraph_utils.inc.php" in the class
DateScaleUtils
DateScaleUtils::GetTicks($aData,$aType==DSUTILS_MONTH1)Possible values for the second argument ($aType) are
Date type Description DSUTILS_MONTHMajor and minor ticks on a monthly basis DSUTILS_MONTH1Major and minor ticks on a monthly basis DSUTILS_MONTH2Major ticks on a bi-monthly basis DSUTILS_MONTH3Major ticks on a tri-monthly basis DSUTILS_MONTH6Major on a six-monthly basis DSUTILS_WEEK1Major ticks on a weekly basis DSUTILS_WEEK2Major ticks on a bi-weekly basis DSUTILS_WEEK4Major ticks on a quad-weekly basis DSUTILS_DAY1Major ticks on a daily basis DSUTILS_DAY2Major ticks on a bi-daily basis DSUTILS_DAY4Major ticks on a quad-daily basis DSUTILS_YEAR1Major ticks on a yearly basis DSUTILS_YEAR2Major ticks on a bi-yearly basis DSUTILS_YEAR5Major ticks on a five-yearly basis
The DateScaleUtils::GetTicks() is a utility function that given
an array of timestamps returns an array of major and minor tick mark positions
that marks the start and middle of each month when we use the
DSUTILS_MONTH1 type specifier.
To make the graph in figure 1 we first note that it is probably a good idea to specify the min and max value of the X-axis ourself rather than letting the auto scale algorithm do that. Since the timestamps are possibly quite large values and the auto scaling algorithm will try to make the start and end values be "even" (for example multiples of 5,10,100, .. and so on).
Secondly we need to chose what scale we will use. In this case it doesn't really matter if we chose a integer (int) or a linear (lin) scale. But since timestamps by definition are integers we select an int scale for the X-axis.
Finally we need to decide what format to have on the labels. For this example
we chose to show it as "Dec05" to indicate "December 2005". The format string
needed to select this is "My" which we will use as argument for the
SetLabelFormatString() method. Since the width of the label is
medium wide we add some empty space on each side of the graph after we
positioned the ticks to avoid the first label "hitting" the Y-axis labels. This
could happen if the start of the first month on the axis is very near the X-Y
axis conjunction.
We will now walk through the code to create the image in Figure 14.69 and explain each step.
First we create some random data for the X and Y axis
1 2 3 4 5 6 7 8 9 10 | $datay = array(); $datax = array(); $ts = time(); $n=15; // Number of data points for($i=0; $i < $n; ++$i ) { $datax[$i] = $ts+$i*700000; $datay[$i] = rand(5,60); } |
Then we get the tick positions for the start of the months
1 2 3 | list($tickPositions, $minTickPositions) = DateScaleUtils::GetTicks($datax); |
We also add a bit of space "grace value" at the beginning and end of the axis
1 2 3 4 5 | $grace = 400000; $xmin = $datax[0]-$grace; $xmax = $datax[$n-1]+$grace; |
It is now time to add the standard code to setup a basic graph. We also set the previously calculated tick positions and the label formatting string we want to use.
Note that we are careful at making sure the x-axis always start at the minimum
y-value (by calling SetPos() ), by default the x-axis is otherwise
positioned at y=0 and if the y-scale happens to start at, say y=10, then the
x-axis is not shown.
1 2 3 4 5 6 7 8 9 10 11 | $graph = new Graph(400,200); $graph->SetScale('intlin',0,0,$xmin,$xmax); $graph->title->Set('Basic example with manual ticks'); $graph->title->SetFont(FF_ARIAL,FS_NORMAL,12); $graph->xaxis->SetPos('min'); $graph->xaxis->SetTickPositions($tickPositions,$minTickPositions); $graph->xaxis->SetLabelFormatString('My',true); $graph->xaxis->SetFont(FF_ARIAL,FS_NORMAL,9); $graph->xgrid->Show(); |
Finally we create and add the plot to the graph and send back the graph to the browser.
1 2 3 4 5 6 | $p1 = new LinePlot($datay,$datax); $p1->SetColor('teal'); $graph->Add($p1); $graph->Stroke(); |
The previous sections showed how to make use of the utility class
DateScaleUtils to manually set the tick marks. The astute
reader will also recall the possibility to use a "date" scale, i.e. specifying
the scale for example as
1 2 3 4 | // Use a date-integer scale $graph->SetScale('datint'); |
So what is the difference and when should this be used?
The answer is that the functionality to some extent overlap but with the manual scale creation there is the possibility to more exact specify the distance between the label marks. By using the "Date" scale the library will automatically adjust the labels to have a suitable distance depending on the span of the data and the size of the graph. This is "easier" but will give little control over the intervals.
With the manual scale, on the other hand, it is possible to exactly specify the distance (e.g. every three month) between each label on the expense of a few more lines of code.
There is also one more important difference an that is that with a "date" scale the tick marks will always be adjusted so that the end and beginning of the scale falls on a major tick marks. If the data to be visualized doesn't completely cover this span there might be "gaps" in the data at the beginning or/and at the end of the x-scale. With a manual scale it is possible to set the min and max x-scale value to match exactly the min/max x-values in the data and have the plot begin and end at exactly the beginning and end of the x-axis. This is not possible to guarantee with a date scale.
Let's put this knowledge to use and compare "side by side" the difference between these two ways of creating a date scale by creating a graph with the same data but using these two different methods.
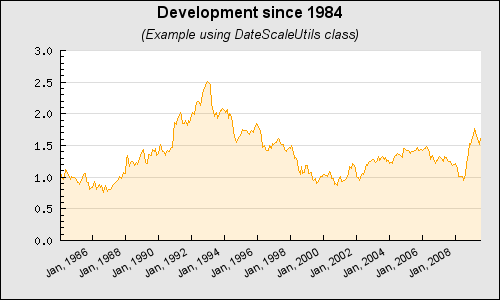
In the first example (shown in Figure 14.70) we use a manually set tick scale with an explicitly set min/max value for the x-axis. The labels on the graph are formatted with a call to
1 | $graph->xaxis->SetLabelFormatString('M, Y',true); |
the second parameter ('true') will make the library interpret the
format string as specifying a date format string.
The second variant will use the exact same data but this time we will use a date scale. This is accomplished by first including the necessary support module jpgraph_date.php and then specifying the scale as
1 | $graph->SetScale('datlin'); |
In order to make the two graphs have exactly the same label format we also use
the same format string as in the previous graph, i.e.
$graph->xaxis->SetLabelFormatString('M, Y',true);. The result
of formatting is shown in Figure 14.71.
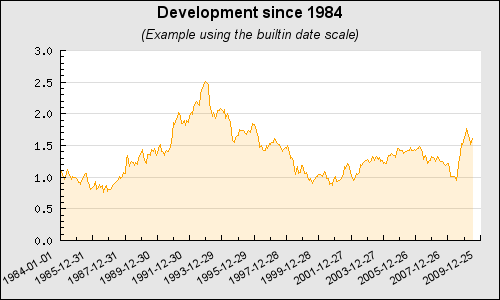
Comparing Figure 14.71. and Figure 14.70 we can see that with the automatic scaling the tick marks match the beginning and ending of the x-scale but at the expense of a small gap at the end of the data since the data doesn't extend quite as far as the scale.