The following section is a summary with a number of examples that illustrates the usage of the methods described in the previous sections.
Objectives:
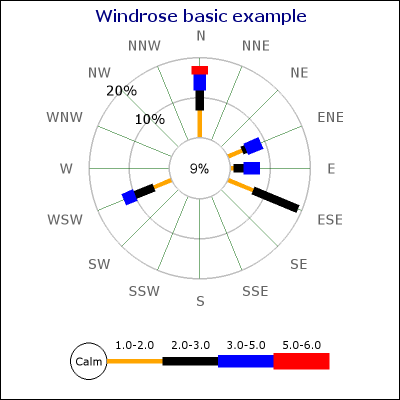
Showing a complete but elementary windrose plot using mostly default values.
Adding and formatting a title
Adding a legend text in order to show the units.
Showing how to specify data using both ordinal and textual representation of compass directions.
Example 21.7. (windrose_ex1.php)
1 2 3 4 5 6 7 8 9 10 11 12 13 14 15 16 17 18 19 20 21 22 23 24 25 26 27 | // content="text/plain; charset=utf-8" require_once ('jpgraph/jpgraph.php'); require_once ('jpgraph/jpgraph_windrose.php'); $data = array( 0 => array(1,1,2.5,4), 1 => array(3,4,1,4), 'wsw' => array(1,5,5,3), 'N' => array(2,7,5,4,2), 15 => array(2,7,12)); // First create a new windrose graph with a title $graph = new WindroseGraph(400,400); // Setup title $graph->title->Set('Windrose basic example'); $graph->title->SetFont(FF_VERDANA,FS_BOLD,12); $graph->title->SetColor('navy'); // Create the windrose plot. $wp = new WindrosePlot($data); $wp->SetRadialGridStyle('solid'); $graph->Add($wp); // Send the graph to the browser $graph->Stroke(); |
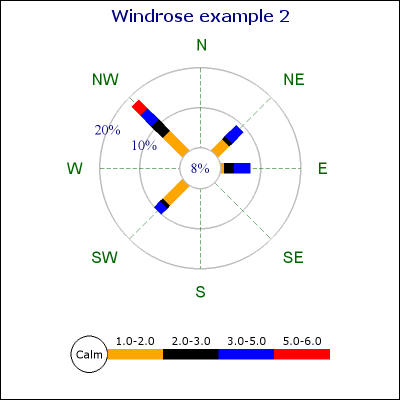
Objectives:
Showing how to customize the width of the windrose legs
Showing how to only display 8 compass axis
Showing how to set a specific size in pixels for the plot
Showing how to adjust the size of the center circle
Showing how to adjust scale label font &colors
Showing how to adjust the font for the compass directions
Example 21.8. (windrose_ex2.php)
1 2 3 4 5 6 7 8 9 10 11 12 13 14 15 16 17 18 19 20 21 22 23 24 25 26 27 28 29 30 31 32 33 34 35 36 37 38 39 40 41 42 43 44 45 46 47 48 | // content="text/plain; charset=utf-8" require_once ('jpgraph/jpgraph.php'); require_once ('jpgraph/jpgraph_windrose.php'); // Data can be specified using both ordinal index of the axis // as well as the direction label $data = array( 0 => array(1,1,2.5,4), 1 => array(3,4,1,4), 3 => array(2,7,4,4,3), 5 => array(2,7,1,2)); // First create a new windrose graph with a title $graph = new WindroseGraph(400,400); // Setup title $graph->title->Set('Windrose example 2'); $graph->title->SetFont(FF_VERDANA,FS_BOLD,12); $graph->title->SetColor('navy'); // Create the windrose plot. $wp = new WindrosePlot($data); // Make it have 8 compass direction $wp->SetType(WINDROSE_TYPE8); // Setup the weight of the laegs for the different ranges $weights = array_fill(0,8,10); $wp->SetRangeWeights($weights); // Adjust the font and font color for scale labels $wp->scale->SetFont(FF_TIMES,FS_NORMAL,11); $wp->scale->SetFontColor('navy'); // Set the diametr for the plot to 160 pixels $wp->SetSize(200); // Set the size of the innermost center circle to 30% of the plot size $wp->SetZCircleSize(0.2); // Adjust the font and font color for compass directions $wp->SetFont(FF_ARIAL,FS_NORMAL,12); $wp->SetFontColor('darkgreen'); // Add and send back the graph to the client $graph->Add($wp); $graph->Stroke(); |
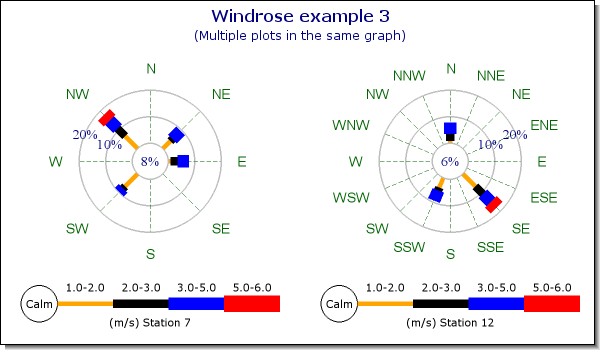
Objectives:
Showing how to add multiple plots to the same graph
Showing how to add a subtitle and a drop shadow to the graph
Showing how to change size and position for plots
Showing how to add legend text
Example 21.9. (windrose_ex3.php)
1 2 3 4 5 6 7 8 9 10 11 12 13 14 15 16 17 18 19 20 21 22 23 24 25 26 27 28 29 30 31 32 33 34 35 36 37 38 39 40 41 42 43 44 45 46 47 48 49 50 51 52 53 54 55 56 57 58 59 60 61 62 63 64 65 66 67 68 69 70 71 72 | // content="text/plain; charset=utf-8" require_once ('jpgraph/jpgraph.php'); require_once ('jpgraph/jpgraph_windrose.php'); // Data can be specified using both ordinal index of the axis // as well as the direction label $data[0] = array( 0 => array(1,1,2.5,4), 1 => array(3,4,1,4), 3 => array(2,7,4,4,3), 5 => array(2,7,1,2)); $data[1] = array( "n" => array(1,1,2.5,4), "ssw" => array(3,4,1,4), "se" => array(2,7,4,4,3)); // Store the position and size data for each plot in an // array to make it easier to create multiple plots. // The format choosen for the layout data is // (type,x-pos,y-pos,size, z-circle size) $layout = array( array(WINDROSE_TYPE8,0.25,0.55,0.4,0.25), array(WINDROSE_TYPE16,0.75,0.55,0.4,0.25)); $legendtxt = array('(m/s) Station 7','(m/s) Station 12'); // First create a new windrose graph with a dropshadow $graph = new WindroseGraph(600,350); $graph->SetShadow('darkgray'); // Setup titles $graph->title->Set('Windrose example 3'); $graph->title->SetFont(FF_VERDANA,FS_BOLD,12); $graph->title->SetColor('navy'); $graph->subtitle->Set('(Multiple plots in the same graph)'); $graph->subtitle->SetFont(FF_VERDANA,FS_NORMAL,9); $graph->subtitle->SetColor('navy'); // Create the two windrose plots. for( $i=0; $i < count($data); ++$i ) { $wp[$i] = new WindrosePlot($data[$i]); // Make it have 8 compass direction $wp[$i]->SetType($layout[$i][0]); // Adjust the font and font color for scale labels $wp[$i]->scale->SetFont(FF_TIMES,FS_NORMAL,10); $wp[$i]->scale->SetFontColor('navy'); // Set the position of the plot $wp[$i]->SetPos($layout[$i][1],$layout[$i][2]); // Set the diameter for the plot to 30% of the width of the graph pixels $wp[$i]->SetSize($layout[$i][3]); // Set the size of the innermost center circle to 30% of the plot size $wp[$i]->SetZCircleSize($layout[$i][4]); // Adjust the font and font color for compass directions $wp[$i]->SetFont(FF_ARIAL,FS_NORMAL,10); $wp[$i]->SetFontColor('darkgreen'); // Add legend text $wp[$i]->legend->SetText($legendtxt[$i]); $graph->Add($wp[$i]); } // Send the graph to the browser $graph->Stroke(); |
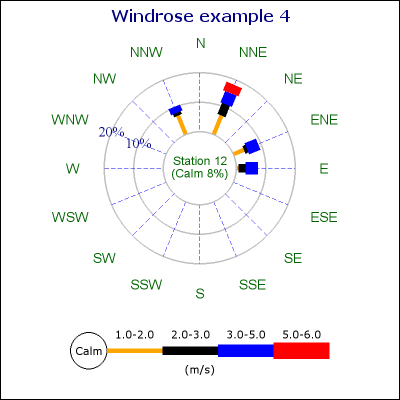
Objectives:
Showing how to add arbitrary paragraphs of text to a graph
Showing how to manually set the grid distance
Showing how to adjust the grid colors
Showing how to customize the format for the displayed ranges
Showing how to add arbitrary text to the center circle
Showing how to adjust the margin for the legend
Showing how to increase the margin to the compass directions
Example 21.10. (windrose_ex4.php)
1 2 3 4 5 6 7 8 9 10 11 12 13 14 15 16 17 18 19 20 21 22 23 24 25 26 27 28 29 30 31 32 33 34 35 36 37 38 39 40 41 42 43 44 45 46 47 48 49 50 51 52 53 54 55 56 57 | // content="text/plain; charset=utf-8" require_once ('jpgraph/jpgraph.php'); require_once ('jpgraph/jpgraph_windrose.php'); // Data can be specified using both ordinal index of the axis // as well as the direction label $data = array( 0 => array(1,1,2.5,4), 1 => array(3,4,1,4), 3 => array(2,7,4,4,3), 5 => array(2,7,1,2)); // First create a new windrose graph with a title $graph = new WindroseGraph(400,400); // Setup title $graph->title->Set('Windrose example 4'); $graph->title->SetFont(FF_VERDANA,FS_BOLD,12); $graph->title->SetColor('navy'); // Create the windrose plot. $wp = new WindrosePlot($data); // Adjust the font and font color for scale labels $wp->scale->SetFont(FF_TIMES,FS_NORMAL,11); $wp->scale->SetFontColor('navy'); // Set the diameter and position for plot $wp->SetSize(190); // Set the size of the innermost center circle to 40% of the plot size // Note that we can have the automatic "Zero" sum appear in our custom text $wp->SetZCircleSize(0.38); $wp->scale->SetZeroLabel("Station 12\n(Calm %d%%)"); // Adjust color and font for center circle text $wp->scale->SetZFont(FF_ARIAL,FS_NORMAL,9); $wp->scale->SetZFontColor('darkgreen'); // Adjust the font and font color for compass directions $wp->SetFont(FF_ARIAL,FS_NORMAL,10); $wp->SetFontColor('darkgreen'); // Adjust the margin to the compass directions $wp->SetLabelMargin(50); // Adjust grid colors $wp->SetGridColor('silver','blue'); // Add (m/s) text to legend $wp->legend->SetText('(m/s)'); $wp->legend->SetMargin(20,5); // Add and send back to client $graph->Add($wp); $graph->Stroke(); |
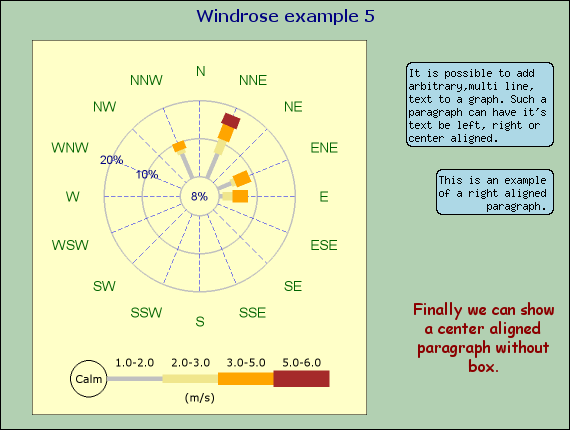
Objectives:
Showing how to add arbitrary paragraphs of text to a graph
Showing how to manually set the grid distance
Showing how to add a box/frame around the individual plot
Showing how to localize the compass directions
Showing how to set customized colors for the ranges
Example 21.11. (windrose_ex5.php)
1 2 3 4 5 6 7 8 9 10 11 12 13 14 15 16 17 18 19 20 21 22 23 24 25 26 27 28 29 30 31 32 33 34 35 36 37 38 39 40 41 42 43 44 45 46 47 48 49 50 51 52 53 54 55 56 57 58 59 60 61 62 63 64 65 66 67 68 69 70 71 72 73 74 75 76 77 78 79 80 81 82 83 84 85 86 87 88 89 90 91 92 93 | // content="text/plain; charset=utf-8" require_once ('jpgraph/jpgraph.php'); require_once ('jpgraph/jpgraph_windrose.php'); // Data $data = array( 0 => array(1,1,2.5,4), 1 => array(3,4,1,4), 3 => array(2,7,4,4,3), 5 => array(2,7,1,2)); // Text to be added. $txt=array(); $txt[0] = "It is possible to add arbitrary,multi line, text to a graph. "; $txt[0] .= "Such a paragraph can have it's text be left, right or center "; $txt[0] .= "aligned."; $txt[1] = "This is an example of a right aligned paragraph."; $txt[2] = "Finally we can show a center aligned paragraph without box."; // We store the layout for each of the text boxes in an array // to keep the code clean $txtlayout = array( array(0.97,0.15,25,'left','black','lightblue'), array(0.97,0.4,20,'right','black','lightblue'), array(0.97,0.7,20,'center','darkred',false,FF_COMIC,FS_NORMAL,12), ); // Range colors to be used $rangeColors = array('silver','khaki','orange','brown','blue','navy','maroon','red'); // First create a new windrose graph with a title $graph = new WindroseGraph(570,430); $graph->title->Set('Windrose example 5'); $graph->title->SetFont(FF_VERDANA,FS_BOLD,12); $graph->title->SetColor('navy'); // Setup graph background color $graph->SetColor('darkgreen@0.7'); // Setup all the defined text boxes $n = count($txt); for( $i=0; $i < $n; ++$i ) { $txtbox[$i] = new Text($txt[$i]); $txtbox[$i]->SetPos($txtlayout[$i][0],$txtlayout[$i][1],'right'); $txtbox[$i]->SetWordwrap($txtlayout[$i][2]); $txtbox[$i]->SetParagraphAlign($txtlayout[$i][3]); $txtbox[$i]->SetColor($txtlayout[$i][4]); $txtbox[$i]->SetBox($txtlayout[$i][5]); if( count($txtlayout[$i]) > 6 ) $txtbox[$i]->SetFont($txtlayout[$i][6],$txtlayout[$i][7],$txtlayout[$i][8]); } $graph->Add($txtbox); // Create the windrose plot. $wp = new WindrosePlot($data); // Set background color for plot area $wp->SetColor('lightyellow'); // Add a box around the plot $wp->SetBox(); // Setup the colors for the ranges $wp->SetRangeColors($rangeColors); // Adjust the font and font color for scale labels $wp->scale->SetFont(FF_ARIAL,FS_NORMAL,9); $wp->scale->SetFontColor('navy'); // Set the diameter and position for plot $wp->SetSize(190); $wp->SetPos(0.35,0.53); $wp->SetZCircleSize(0.2); // Adjust the font and font color for compass directions $wp->SetFont(FF_ARIAL,FS_NORMAL,10); $wp->SetFontColor('darkgreen'); // Adjust the margin to the compass directions $wp->SetLabelMargin(50); // Adjust grid colors $wp->SetGridColor('silver','blue'); // Add (m/s) text to legend $wp->legend->SetText('(m/s)'); $wp->legend->SetMargin(20,5); // Add plot and send back to client $graph->Add($wp); $graph->Stroke(); |
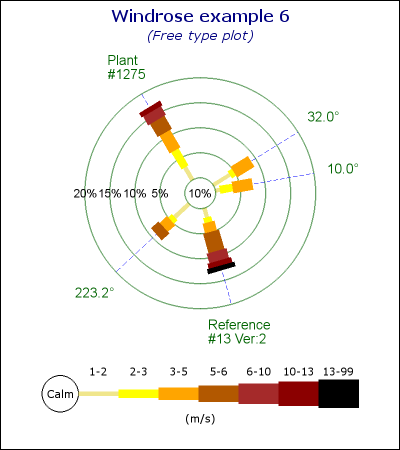
Objectives:
Set range colors
Set grid colors
Showing how to adjust the label margin
Showing how to change the format for displayed legend values
Example 21.12. (windrose_ex6.php)
1 2 3 4 5 6 7 8 9 10 11 12 13 14 15 16 17 18 19 20 21 22 23 24 25 26 27 28 29 30 31 32 33 34 35 36 37 38 39 40 41 42 43 44 45 46 47 48 49 50 51 52 53 54 55 56 57 58 59 60 61 62 63 64 65 66 67 68 69 70 71 | // content="text/plain; charset=utf-8" require_once ('jpgraph/jpgraph.php'); require_once ('jpgraph/jpgraph_windrose.php'); // Data can be specified using both ordinal index of the axis // as well as the direction label $data = array( '10' => array(1,1,2.5,4), '32.0' => array(3,4,1,4), '120.5' => array(2,3,4,4,3,2,1), '223.2' => array(2,4,1,2,2), '285.7' => array(2,2,1,2,4,2,1,1) ); // Specify text for direction labels $labels = array( '120.5' => "Plant\n#1275", '285.7' => "Reference\n#13 Ver:2"); // Range colors to be used $rangeColors = array('khaki','yellow','orange','orange:0.7','brown','darkred','black'); // First create a new windrose graph with a title $graph = new WindroseGraph(400,450); // Setup titles $graph->title->Set('Windrose example 6'); $graph->title->SetFont(FF_VERDANA,FS_BOLD,12); $graph->title->SetColor('navy'); $graph->subtitle->Set('(Free type plot)'); $graph->subtitle->SetFont(FF_VERDANA,FS_ITALIC,10); $graph->subtitle->SetColor('navy'); // Create the windrose plot. $wp = new WindrosePlot($data); // Setup a free plot $wp->SetType(WINDROSE_TYPEFREE); // Setup labels $wp->SetLabels($labels); $wp->SetLabelPosition(LBLPOSITION_CENTER); $wp->SetLabelMargin(30); // Setup the colors for the ranges $wp->SetRangeColors($rangeColors); // Adjust the font and font color for scale labels $wp->scale->SetFont(FF_ARIAL,FS_NORMAL,9); // Set the diameter and position for plot $wp->SetSize(230); $wp->SetZCircleSize(30); // Adjust the font and font color for compass directions $wp->SetFont(FF_ARIAL,FS_NORMAL,10); $wp->SetFontColor('darkgreen'); // Adjust grid colors $wp->SetGridColor('darkgreen@0.7','blue'); // Add (m/s) text to legend $wp->legend->SetText('(m/s)'); // Display legend values with no decimals $wp->legend->SetFormat('%d'); // Add plot to graph and send back to the client $graph->Add($wp); $graph->Stroke(); |
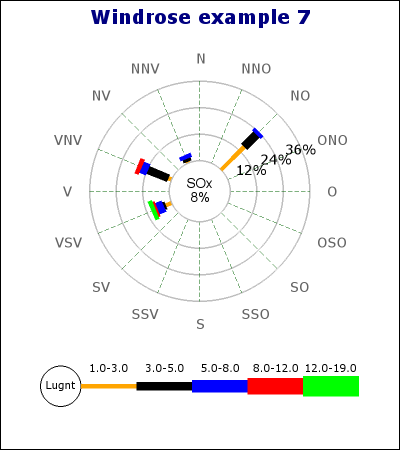
Objectives:
Showing how to change the direction labels
Adjust the displayed ranges
Showing how to change the format for displayed legend values
Showing how to manually setting the scale range and scale step size
Example 21.13. (windrose_ex7.php)
1 2 3 4 5 6 7 8 9 10 11 12 13 14 15 16 17 18 19 20 21 22 23 24 25 26 27 28 29 30 31 32 33 34 35 36 37 38 39 40 41 42 43 44 45 46 47 48 49 50 | // content="text/plain; charset=utf-8" require_once ('jpgraph/jpgraph.php'); require_once ('jpgraph/jpgraph_windrose.php'); $data = array( 2 => array(1,15,7.5,2), 5 => array(1,1,1.5,2), 7 => array(1,2,10,3,2), 9 => array(2,3,1,3,1,2), ); // First create a new windrose graph with a title $graph = new WindroseGraph(400,450); $graph->title->Set('Windrose example 7'); $graph->title->SetFont(FF_VERDANA,FS_BOLD,14); $graph->title->SetColor('navy'); // Create the free windrose plot. $wp = new WindrosePlot($data); $wp->SetType(WINDROSE_TYPE16); // Add some "arbitrary" text to the center $wp->scale->SetZeroLabel("SOx\n8%%"); // Localize the compass direction labels into Swedish // Note: The labels for data must now also match the exact // string for the compass directions. $se_CompassLbl = array('O','ONO','NO','NNO','N','NNV','NV','VNV', 'V','VSV','SV','SSV','S','SSO','SO','OSO'); $wp->SetCompassLabels($se_CompassLbl); // Localize the "Calm" text into Swedish and make the circle // slightly bigger than default $se_calmtext = 'Lugnt'; $wp->legend->SetCircleText($se_calmtext); $wp->legend->SetCircleRadius(20); // Adjust the displayed ranges $ranges = array(1,3,5,8,12,19,29); $wp->SetRanges($ranges); //$wp->SetAntiAlias(true); // Set the scale to always have max value of 30 with a step // size of 12. $wp->scale->Set(30,12); // Finally add it to the graph and send back to client $graph->Add($wp); $graph->Stroke(); |
Objectives:
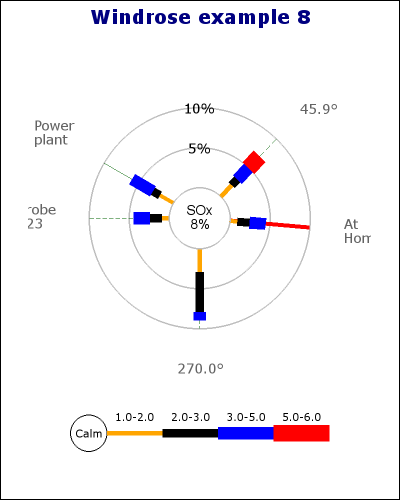
Different styles of radial grid lines for a type 8 plot
Adding partial labels
Example 21.14. Show how to set different styles for individual radial grid lines (windrose_ex8.php)
1 2 3 4 5 6 7 8 9 10 11 12 13 14 15 16 17 18 19 20 21 22 23 24 25 26 27 28 29 30 31 32 33 34 35 36 37 38 39 40 41 42 43 44 45 46 47 | // content="text/plain; charset=utf-8" require_once ('jpgraph/jpgraph.php'); require_once ('jpgraph/jpgraph_windrose.php'); // Data can be specified using both ordinal index of the axis // as well as the direction label. $data = array( '45.9' => array(3,2,1,2,2), 355 => array(1,1,1.5,2), 180 => array(1,1,1.5,2), 150 => array(1,2,1,3), 'S' => array(2,3,5,1), ); // Add some labels for afew of the directions $labels = array(355=>"At\nHome base",180=>"Probe\n123",150=>"Power\nplant"); // Define the color,weight and style of some individual radial grid lines. $axiscolors = array(355=>"red"); $axisweights = array(355=>8); $axisstyles = array(355=>'solid',150=>'solid'); // First create a new windrose graph with a title $graph = new WindroseGraph(400,500); $graph->title->Set('Windrose example 8'); $graph->title->SetFont(FF_VERDANA,FS_BOLD,14); $graph->title->SetColor('navy'); // Create the free windrose plot. $wp = new WindrosePlot($data); $wp->SetType(WINDROSE_TYPEFREE); // Specify colors weights and style for the radial gridlines $wp->SetRadialColors($axiscolors); $wp->SetRadialWeights($axisweights); $wp->SetRadialStyles($axisstyles); // Add a few labels $wp->SetLabels($labels); // Add some "arbitrary" text to the center $wp->scale->SetZeroLabel("SOx\n8%%"); // Finally add it to the graph and send back to client $graph->Add($wp); $graph->Stroke(); |
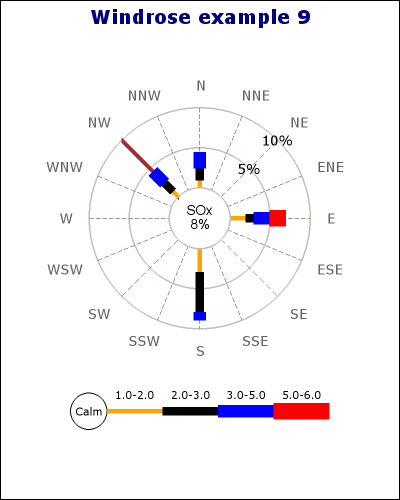
Objectives:
Set radial grids for a type 16 plot
Example 21.15. (windrose_ex9.php)
1 2 3 4 5 6 7 8 9 10 11 12 13 14 15 16 17 18 19 20 21 22 23 24 25 26 27 28 29 30 31 32 33 34 35 36 37 38 39 40 41 42 43 44 45 | // content="text/plain; charset=utf-8" require_once ('jpgraph/jpgraph.php'); require_once ('jpgraph/jpgraph_windrose.php'); // Data can be specified using both ordinal index of the axis // as well as the direction label. $data = array( 'E' => array(3,2,1,2,2), 'N' => array(1,1,1.5,2), 'nw' => array(1,1,1.5,2), 'S' => array(2,3,5,1), ); // Define the color,weight and style of some individual radial // grid lines. Axis can be specified either by their (localized) // label or by their index. // Note; Depending on how many axis you have in the plot the // index will vary between 0..n where n is the number of // compass directions. $axiscolors = array('nw'=>'brown'); $axisweights = array('nw'=>8); // Could also be specified as 6 => 8 $axisstyles = array('nw'=>'solid'); // First create a new windrose graph with a title $graph = new WindroseGraph(400,500); $graph->title->Set('Windrose example 9'); $graph->title->SetFont(FF_VERDANA,FS_BOLD,14); $graph->title->SetColor('navy'); // Create the free windrose plot. $wp = new WindrosePlot($data); $wp->SetType(WINDROSE_TYPE16); // Specify colors weights and style for the radial gridlines $wp->SetRadialColors($axiscolors); $wp->SetRadialWeights($axisweights); $wp->SetRadialStyles($axisstyles); // Add some "arbitrary" text to the center $wp->scale->SetZeroLabel("SOx\n8%%"); // Finally add it to the graph and send back to the client $graph->Add($wp); $graph->Stroke(); |
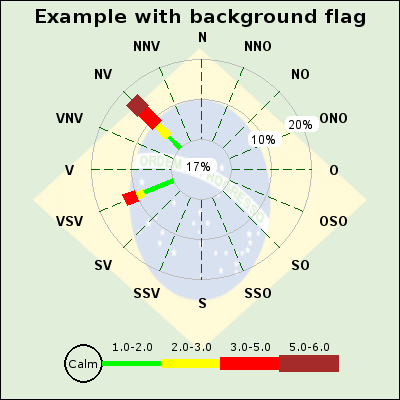
Objectives:
Showing how to add a background image which is one of the country flags
Example 21.16. (windrose_bgimg_ex1.php)
1 2 3 4 5 6 7 8 9 10 11 12 13 14 15 16 17 18 19 20 21 22 23 24 25 26 27 28 29 30 31 32 33 34 35 36 37 38 39 40 41 42 43 44 45 46 47 48 49 | // content="text/plain; charset=utf-8" require_once ('jpgraph/jpgraph.php'); require_once ('jpgraph/jpgraph_windrose.php'); require_once ('jpgraph/jpgraph_flags.php'); // Data can be specified using both ordinal idex of axis as well // as the direction label $data2 = array( 'vsv' => array(12,8,2,3), 6 => array(5,4,4,5,4), ); $se_CompassLbl = array('O','ONO','NO','NNO','N','NNV','NV','VNV','V','VSV','SV','SSV','S','SSO','SO','OSO'); // Create a new small windrose graph $graph = new WindroseGraph(400,400); $graph->SetMargin(25,25,25,25); $graph->SetFrame(); $graph->title->Set('Example with background flag'); $graph->title->SetFont(FF_VERA,FS_BOLD,14); //$graph->SetBackgroundImage('bkgimg.jpg',BGIMG_FILLFRAME); //$graph->SetBackgroundImageMix(90); $graph->SetBackgroundCFlag(28,BGIMG_FILLFRAME,15); $wp2 = new WindrosePlot($data2); $wp2->SetType(WINDROSE_TYPE16); $wp2->SetSize(0.55); $wp2->SetPos(0.5,0.5); $wp2->SetAntiAlias(false); $wp2->SetFont(FF_ARIAL,FS_BOLD,10); $wp2->SetFontColor('black'); $wp2->SetCompassLabels($se_CompassLbl); $wp2->legend->SetMargin(20,5); $wp2->scale->SetZFont(FF_ARIAL,FS_NORMAL,8); $wp2->scale->SetFont(FF_ARIAL,FS_NORMAL,9); $wp2->scale->SetLabelFillColor('white','white'); $wp2->SetRangeColors(array('green','yellow','red','brown')); $graph->Add($wp2); $graph->Stroke(); |